Porous materials are a class of materials with low density, large specific surface and a range of novel properties in the physical, mechanical, thermal, electrical, and acoustical fields. The relationship between the structure and the properties of cellular solids made of natural materials and the properties of engineered materials including metals, ceramics, and polymer. Porous materials can be categorized into closed porous and open porous structures. Closedfoams can be used potentially in applications that need light-weight structural elements with better sound and impact energy absorption. Open foams can also be used for high-performance applications such as heat exchangers and heat sinks for thermal management, and also for medical implants, filters, and electrodes for biological and chemical reactions. In recent years, there has been a strong focus on metal materials with higher porosity (more than around 70%) such as metal foams, cellular metals and metal sponges. Most of these materials have been developed for use as structural components.
In the field of powder metallurgy (PM), on the other hand, porous metal materials with comparatively low porosities (0%-30%) have been attracting most attention in recent years. They have been used mostly for tribological applications such as oil-impregnated sintered bearings. Porous materials have not traditionally been an area of innovation in the field of PM. In the case of sintered materials used for mechanical parts, the emphasis has been more on high densification to enhance durability, strength and reliability in service. The metal injection molding (MIM) process has been developed using fine metal powders, thereby enabling the manufacture of sintered parts that are more dense and precise than those manufactured in PM.
However, open porous metals are finding many applications in high-tech products, e.g., biofilters for medical microscopic measurements, heat exchangers for microdevices, and micromist-generators for filtering air dust and bacteria, medical implants with low modulus, vapor recovery equipment for fuel cells, and so on. These applications can benefit from the advantages provided by microporous structures. Many pores can be created easily by control of sintering in the PM and MIM process.The pores are polygonal (rather than spherical) spaces between particles with high permeability.
The key challenge is how the porous structure is formed by the MIM process to create a controlled pore size and porosity. It is essential for the MIM process to remove most of the polymeric binders from the molded body while keeping the shape formed by the metal powder. Debinding technology is used to create a precise number of spaces during pore formation. MIM is also a net-shape manufacturing process without any mechanical cutting and polishing, where the pores formed on the surface are not subject to damage by machining forces. This makes the MIM process the preferred manufacturing process for net-shaped porous metal parts.
This chapter will also discuss other forming techniques for the manufacture of microporous metal parts, which have been recently developed by combining the powder space holder (PSH) method with the MIM process. The effects of material combination and sintering conditions on the pore formation and the physical properties of sintered porous metals are described in detail. Further advantages of the PSH-MIM method, such as excellent liquid infiltration properties, high-dimensional accuracy in production and enhancement of mechanical properties by using functionally graded porous structures, are reviewed.
In most porous metals, the pore size tends to become smaller as the product gets smaller. Macrosized porous structures are created by conventional machining methods such as cutting, grinding, welding, and fastening. Microsized porous parts, however, require net-shape manufacturing in complicated shapes with highdimensional accuracy and the porous structure forming on the surface. So far, there have been few studies that have dealt with net-shape production of microporous metal components, although these methods are very desirable when producing components with higher functionalities at a lower cost. A noted textbook on PM describes the fabrication of controlled pore structures for bearings, filters, flow restrictors, sound absorbers, heat pipes, and biomedical implants as a natural application for PM. Control of the pore size is achieved by using powder grains within a narrow size range and by closely controlling densification during the processing of the materials. The possibility of pore structure manipulation is in fact the key reason for selecting PM to fabricate porous metals and this has been so since the early days of PM technology.
Generally speaking, sintering can make small pores easier to achieve than is possible using foaming or deposition methods. Traditional PM, however, cannot produce micrometer or submicrometer sized pores with sufficient porosity, because there is a limit in combining pore size and porosity with this technology. The resulting pores are also interglobular interstices whose shape is not ideal for fluid infiltration.
Fig. 17.1 shows the ranges of porosity and type of porous structure against pore size for typical PM production methods of porous metals. These products can be manufactured with existing commercial production methods such as (a) sintering of metal powders, (b) sintering of hollow spheres, (c) sintering of metal textiles, (d) electron deposition, (e) melt gas injection in liquid metal, (f ) entrapped gas expansion, and so on (Wadley, 2002). Each method can be used with a small subset of methods to create porous metals with a limited range of porosity and pore size. In practice, it is very difficult to produce porous metal components with pore sizes up to several tens of micrometers and either open or closed porous structures with a specified porosity.
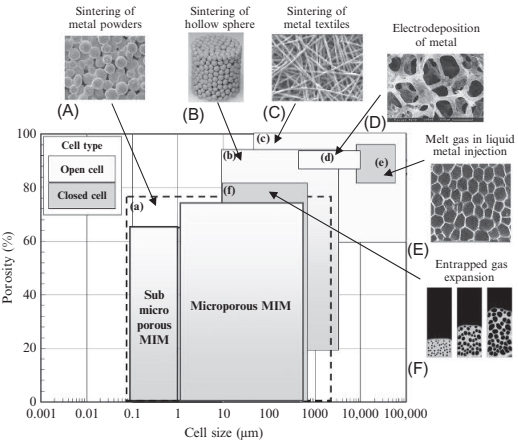
Fig. 17.1 Porosity against cell size for typical production methods of porous metals.
At the moment few methods can in practice produce net-shaped metal components efficiently. It is even more complicated to produce porous metals with graded properties and complex shapes. The microporous MIM and submicron porous MIM processes developed by the authors have the potential to achieve the desired production results. The process has three main advantages:
a wide range of independently controlled porosities and pore sizes as shown in Fig. 17.1;
net-shape mass-production with high-dimensional accuracy;
various material combinations and graded structures.
MIM is a manufacturing method that combines traditional PM with plastic injection molding. Over the past decade it has established itself as a competitive manufacturing process for small precision components that would be costly to produce by alternative methods. It can be used to produce comparatively small parts with complex shapes from almost any type of material such as metals, ceramics, intermetallic compounds and composites. Recently, MIM has been studied not only for hard metals, but also for materials such as titanium, copper, and aluminum. Unlike in the case of PM, MIM requires mixing metal powders with a large amount of polymeric binder. After this, the organic constituents are removed in a debinding step such as solvent extraction or pyrolysis. The brown body is held in the molded form only by metal powder after debinding. This debinding process and powder forming mechanism is unique to the MIM process.
A variety of MIM products produced by the authors are shown in Fig. 17.2. These suggest that various structures of MIM parts are determined by the homogeneity of the metal powder in the mold cavity and the continued solids loading of metal powder into the feedstock. To mix feedstock homogeneously, the mold cavity needs to be densely filled. High-precision MIM parts and microstructured MIM parts can be manufactured where the feedstock is injection-molded into a microstructured cavity made of plastic. This process has been named micro sacrificial plastic mold insert MIM (μ-SPiMIM) by the authors.
The authors have produced metal components with a microsized porous structure by applying the PSH method to the MIM process. The PSH method makes use of the unique polymer-based MIM techniques developed by the authors. A homogeneous feedstock and polymeric cavities were used to make highly porous structured MIM parts. The compounds prepared by fractioning of space-holding particles were coinjection molded to make porous graded and structured MIM parts. The authors achieved some success when working with high-quality and micro-MIM processes, but sintering and mixing was poor, which caused segregation between metal powder and binder.
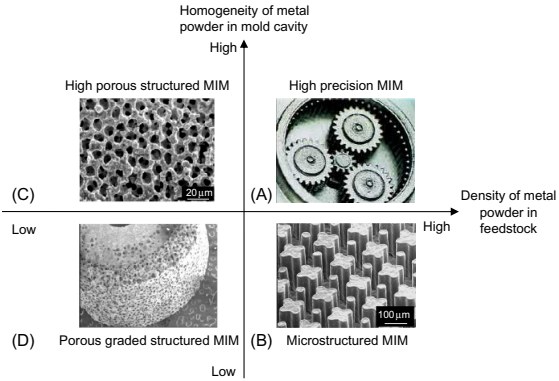
Fig. 17.2 Variously structured MIM parts determined by homogeneity of metal powder in mold cavity and density of metal powder in feedstock.
The PSH method for microporous metals was developed based on the MIM process as illustrated in Fig. 17.3. In a conventional MIM process, the feedstock is composed of metal powder and binders; a high densification after debinding and the sintering process is very important for high-quality MIM products. However, to produce highly porous structured metals, the spaces created are required to remain stable after sintering. It is therefore useful to apply the PSH method to the MIM process. It is most important to establish the kinds of material that should be used for space holding in the process. It is preferable that the candidate materials are diffluent by water and organic solvents such as sugar, salt, and polymers. There are many other requirements, such as spherical shape, availability of various particle sizes, high rigidity, thermal resistance, nonreactiveness to metal powder, reasonable cost, safety, and so on. The authors have chosen mostly spherical particles made of polymethylmethacrylate (PMMA) polymer to fulfill such a requirement. PMMA polymer can be produced by monodispersed particles with a wide range of particle size from submicrometer to millimeters, and it has comparatively high-thermal resistance and stiffness. PMMA also exhibits compatible mixing with wax and polymeric binders used in MIM feedstocks.
In the authors' process, in addition to metal powder and thermoplastic binders, extra coarse spherical materials made of PMMA were used as lost material to obtain a fine porous structure in the MIM components. As already explained, the combination of space-holding particles and metal powder together with the sintering conditions determine the porous structure. The PSH-MIM process illustrated in Fig. 17.3 is carried out in four steps as follows.
The first step is mixing the metal powder, binder, and space-holding particles to prepare the porous compound.
The second step is molding the porous compound into the specified shapes by injection, extrusion molding or press forming to obtain the green bodies.
The third step is thermal debinding to remove the binder and space-holding particles.
The final step is sintering of the metal powders while keeping the dimensions of the created spherical spaces.
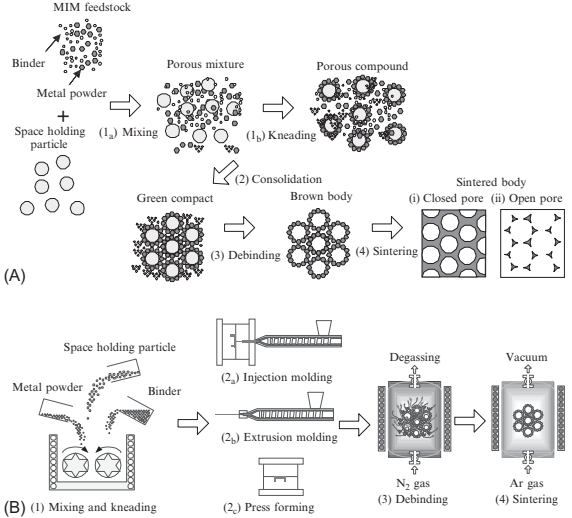
Fig. 17.3 Powder space holder (PSH) MIM process for manufacturing microporous metal parts: (A) pore formation mechanism; (B) process flow
A key technology in the PSH method is to remove the space-holding particles which are used to make large numbers of spherical spaces. The debinding mechanism, simplified for a two-component binder system, is explained in this section. Fig. 17.4A shows the typical debinding and sintering conditions for a green body molded using feedstock composed of 9μm stainless steel powder and polymeric binder. Debinding is done at 600℃ for 2 h, while sintering is carried out at around 1050℃ for 2 h. Fig. 17.4B shows the thermogravimetric curves for the decomposition of wax, polymer and space-holding particle (PMMA particles). Using three decomposition curves, a typical debinding mechanism for this material system can be determined. Fig. 17.5 shows a schematic drawing of the debinding process at each temperature. No materials decompose below 100℃. Wax starts to decompose at 250℃, and creates numerous paths for degassing near the PMMA particle. Then the PMMA decomposes along with the wax at 300℃. When the temperature is further increased to 350℃, large amounts of PMMA and polymer decompose simultaneously. Finally, all of the binder constituents and PMMA particles have been decomposed completely over 500℃.
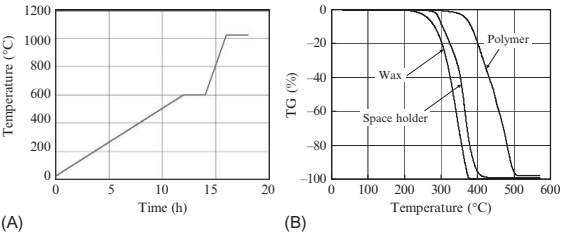
Fig. 17.4 PSH method for producing microporous metals: (A) debinding-sintering conditions; (B) thermogravimetric (TG) curves in debinding
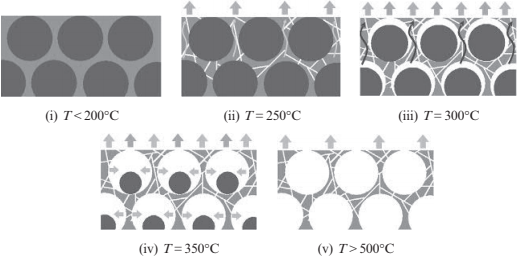
Fig. 17.5 Schematic drawing of debinding process
The PSH method can be applied to most kinds of metal powder, such as stainless steels, nickel, aluminum, copper, titanium, and their alloys, as shown in Fig. 17.6. The pore size can be determined by diameter of space-holding particle, which can actually be prepared in a wide range of sizes, from submicrometers to a few hundred micrometers or larger. However, spherical pores are not completely accurately formed in all specimens, because of mismatches in size of some of the space-holding particles that are needed to match each metal powder particle.
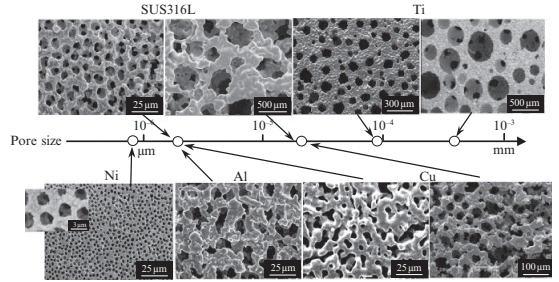
Fig. 17.6 SEM images and pore sizes of microporous metals manufactured by PSHMIM method
The surface structures of porous specimens produced using pure Ni powder (D50=0.49μm) and various sizes of spherical PMMA particles (D50=1.5, 3, 5μm), with a volumetric ratio of 60% in porous compounds, are shown in Fig. 17.7. Because the compounds are prepared using submicron powders with highly specific surface areas, the melt viscosity is very high, and the melt is then not easy to compact by injection molding. The molding was carried out under constant conditions where die temperature and gauge pressure was 200℃ and 10MPa, respectively. Debinding and sintering were sequentially carried out at 600℃ for 2 h in N2 and at 900℃ for 2 h in Ar gas atmospheres in an industrial vacuum furnace to avoid oxidizing. Unsurprisingly, these specimens become reduced in pore size the smaller the PMMA particles that are used for holding spaces. As for the shape of the pores, in the cases of 3 and 5μm PMMA specimens, an orderly matrix of spherical polygonal pores, with a smaller size than each diameter of PMMA particle, is visible. On the other hand, the 1.5μm PMMA specimen lost shape in the sphere and formed numerous polygonal spaces with a size on the submicron scale. A larger difference was obtained in the 1.5μm PMMA specimen where the pore could not hold a spherical shape because the ratio of diameter of Ni powder to PMMA particle is not large enough, so that Ni powders could not be filled into the cells among the PMMA particles. In that case, the PSH method can achieve a well-defined porous specimen, provided that the pore holds a spherical shape. In the trial production of the sintered porous metal, it was possible to achieve open pores formed homogeneously with 0.65μm in mean pore diameter and 67% porosity. Porosity, pore size, and surface area were easily controlled by optimizing the fraction of spherical materials for space-holding sintering process conditions.
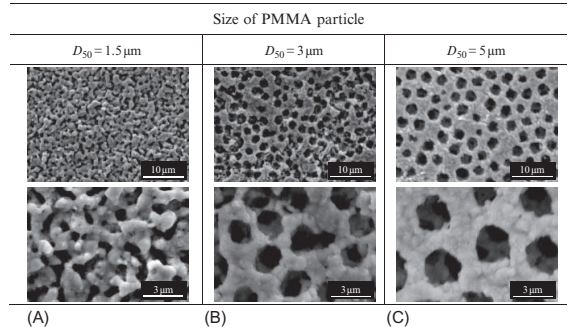
Fig. 17.7 Surface structures of Ni porous specimens produced using various sizes of PMMA particles
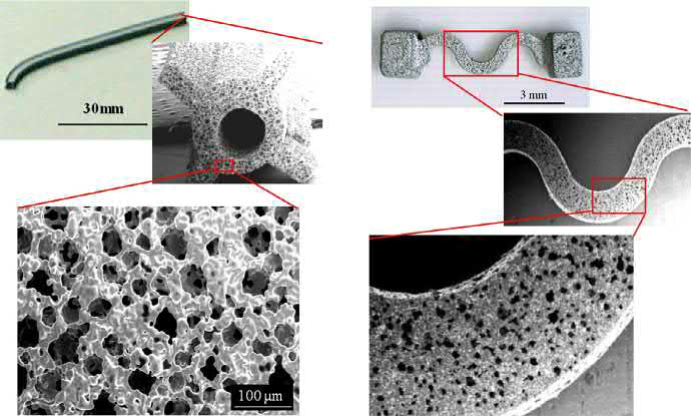
Another advantage of the PSH method lies in the possibility for net-shape production of microporous metal components with complicated shapes and highly functionally graded structures. Fig. 17.8 shows typical examples of microporous metal parts manufactured by extrusion molding (Fig. 17.8A) and injection molding (Fig. 17.8B) processes. The porous compound used is 9μm 316L powder and 50μm PMMA particle with a volumetric ratio of 60%. Longitudinal parts are better manufactured using extrusion molding, and complex-shaped parts have benefited from injection molding. The injection molded parts have a slightly denser surface than extruded ones for the reason outlined later.
(A) (B)
Fig. 17.8 Porous metal parts produced by different molding method using 9μm 316L powder and 50μm PMMA particle with volumetric percentage of 60%: (A) extrusion molding and (B) injection molding
Fig. 17.9 shows the effects of particle size on pore formation on the surface of porous metals produced by injection molding and extrusion molding processes. In the case of extrusion molding, the pore size and porosity appearing on the surface were reduced in the specimen produced using finer metal powders (D50¼3μm), which were holding the filling around the PMMA particles (D50¼50μm). An increase of pore size and porosity, however, is visible in the specimen produced using coarser metal powders (D50¼9μm), which were rearranged by PMMA particles that were elastic-deformed after extruding from the die. It is clear from these results that the porous structure on the surface is affected by the particle diameter of the metal powder used. In the case of injection molding, on the other hand, the pores are not changed after demolding because high molding pressure is applied in the cavity and metal powders are held in the green compact by cooling the polymeric binder before it is ejected from the mold. It is therefore clear that molding pressure and its relaxation affect the pore structure on the surface. This effect could be used to produce complex sintered porous parts with dense surfaces by one-step injection molding.
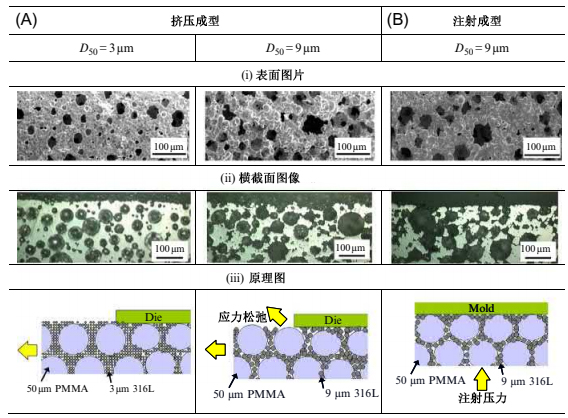
Fig. 17.9 Effects of particle size and molding methods on pore formation on the surface of porous metals
Table 17.1 Experimental materials and fraction of constituents
Table 17.1 Experimental materials and fraction of constituents
Compositions | Mean diameter | Volume fraction | ||
MIM feedstock | Porous compound | |||
Metal powder | Stainless steel, 316L | 3, 9 μm | 50 vol% | 20–100 vol% |
Binder | Wax, polyacetal | – | 50 vol% | |
Space-holding particle | PMMA | 10 μm 50 μm | – | 0–80 vol% |
The experimental materials used for porous compounds are listed in Table 17.1. The metal powders`, loaded at 50 vol%, were austenitic stainless steel 316 L (D50=3, 9μm) produced by the water-atomization method. The binder was paraffin wax and polyacetal polymer. Spherical particles (D50=10, 50μm) made from PMMA were used for holding the metal powder in position. These materials were comixed and pelletized with a high-pressure kneader and a plunger-type extruder. The resulting specimens are labeled specimen 3-10 or specimen 3-50. In the first case, 10μm PMMA particles together with 3μm sized 316L powder were used. For the second specimen, 50μm PMMA particles were mixed with 3μm sized 316L powder. Specimen 9-50 is produced with 50μm PMMA particles and 9μm 316L powder. The fraction rate of PMMA particles varied from 0 to 80 vol%, being the main experimental parameter. To keep the experiments simple, circular dishes of green compacts (40mm diameter, 2mm thick) were prepared from various porous compounds by hot press molding. The samples could also be produced by injection molding. Hot press molding was carried out under constant conditions where die temperature was 200°C and gauge pressure was 10MPa. Debinding and sintering were sequentially carried out at 600°C for 2 h in N2 and at 1050–1200°C for 2 h in Ar gas atmosphere to avoid oxidizing.
The surface structure of the sintered specimen was observed by scanning under the electron microscope. The microstructures on the surface of the sintered specimen produced by using various porous compounds are shown in Fig. 17.10. The number of pores on the surface increases as the fraction of PMMA particles increases from 0 to 80 vol%. The pore size is significantly dependent on the diameter of PMMA particles. These characteristics are typical for pore formation behavior of the PSH method. To make microsized porous stainless steel with a much higher surface-to-volume ratio, it is better to use compounds with a combination of 3μm 316L powder and 10μm PMMA particles.
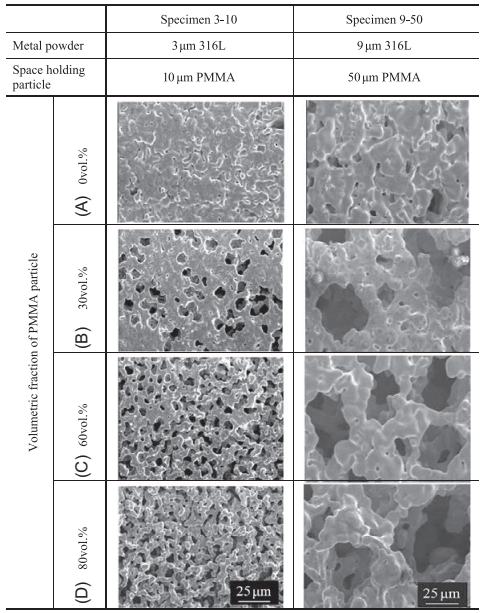
Fig. 17.10 SEM images on surface of sintered specimens with various sizes of metal powder and PMMA particle
The relative density (as an inverse of the porosity) and the shrinkage of the sintered specimen were measured with micrometer calipers and an analytical balance. Fig. 17.11 shows the shrinkage and the porosity of sintered porous specimens with various fractions of PMMA particles. Specimens 3-10 and 9-50 were sintered at 1050°C and 1200°C, respectively. For both specimens, the shrinkage is between 15 and 20 vol% and up to 50–60 vol% of PMMA particles. However, it increases rapidly when the fraction of PMMA particles becomes higher than 50–60 vol%. The transition point corresponds to the change from a closed porous structure to an open porous one. In other words, the shrinking percentage stays constant in a closed porous structure regardless of the content of PMMA particles. In an open porous structure, the shrinking percentage will increase when the fraction of PMMA particles rises. The definite transition points are shown at the boundary between the closed porous structure and open porous structure. In the second graph, the porosity of both specimens increases as the fraction of PMMA particles increases. Here too, two regions can be distinguished, with a transition point between them. This result is similar to the first graph, where the shrinkage was plotted against the fraction of PMMA particles.
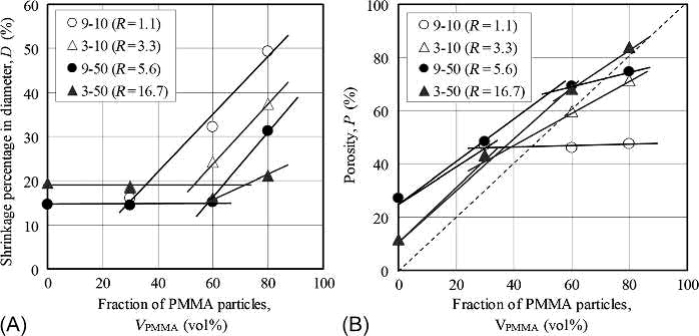
Fig. 17.11 Shrinkage and porosity as function of fraction of space-holding particles: (A) shrinkage diameter; (B) porosity
Concerning the sintered specimen described previously, the pore size, pore distribution, surface area, and the flow resistance against a fluid were measured with a capillary flow porometer (Porous Materials Inc., CPF-1100-AXLSP). The distributions of minimal pore size for sintered specimens with various sizes of PMMA particles are shown in Fig. 17.12. The minimal pore size and the specific surface are listed in Table 17.2. As the PMMA particle size decreases, the average minimal pore diameter decreases accordingly, but the specific surface area increases significantly. As a result, the average minimal diameter of pores was approximately equal to one quarter of the diameter of the PMMA particle.
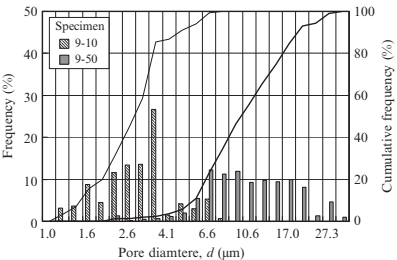
Fig. 17.12 Distributions of minimal pore size of sintered specimens with various sizes of PMMA particle
Fig. 17.13 shows the shrinkage percentagein diameter and porosity for porous specimens with 60 vol% PMMA particles sinteredat varioustemperatures. These results showedthat the shrinkage increased and the porosity decreased accordingly in all specimens whenthe sintering temperature was increased. These phenomena agree with findings that the pore size tends to get smaller when the specimen undergoes excess sintering. The shrinkage percentage in diameter is ideally 20%, which is calculated by the volume of solid load of the MIM feedstock, i.e., 50 vol%. Therefore, when the sintering temperature is set at 1050°C for 3μm 316L-10μm PMMA (specimen 3-10), 1200°C for 3μm 316L-50μm PMMA (specimen 3-50), and 1300°C for 9μm 316L-50μm PMMA (specimen 9-50), the shrinkage percentage in diameter will be close to 20%. In that case, a porosity could be achieved very close to the added content of PMMA particle, i.e., 60 vol%.
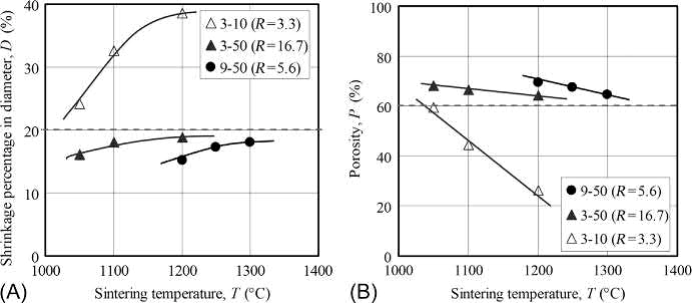
Fig. 17.13 Shrinkage and porosity as a function of sintering temperature (60 vol% PMMA): (A) shrinkage in diameter; (B) porosity
It can be concluded that porous structures with equally sized pores can be obtained under the sintering conditions noted previously for each combination of sizes of metal powder and space-holding particles. It can be seen that sintering is more active in finer metal powder at higher sintering temperatures. Small pores form between metal particles by insufficient sintering in 50μm PMMA specimens (specimens 3-50 and 9-50). Cellular pores resulting from space-holding particles are significantly affected by sintering temperature in the 10μm PMMA specimens (specimen 3-10).
The effects of sintering temperature on the porous structural characteristics in the case of the 3μm 316L-10μm PMMA specimen (specimen 3-10) were then investigated in more detail. The distributions of the smallest pore size for specimens sintered at various temperatures are shownin Fig. 17.14. Atlower sinteringtemperatures suchas 1020°C,the mean pore size is 1.65μm and the pore structure has a broad distribution. At higher sintering temperatures, such as 1070°C, the mean pore size was almost unchanged at 1.62μm, but the distribution became much sharper. This is considered a result of ongoing sintering between metal powders surrounding large pores held by the space particles. When the sintering temperature is increased to 1100°C, the mean size was significantly reduced to 0.91 μm but the sharp distribution remained. This is due to densification and can be seen on scanning electron microscopy (SEM) images from the surface of the specimens sintered at various temperatures, as shown in Fig. 17.15. The surface area of specimens sintered at varioustemperatureswasmeasured andis shown in Fig. 17.16. Specifically, the surface decreases in a linear manner with increased sintering temperature. The resistance against fluid flow after applying various temperatures was measured, and is shown in Fig. 17.17. Specifically, water flow reduced significantly asthe sinteringtemperature increased. These results are compatible with a decreasing of pore size in specimens sintered at higher temperature, as discussed previously.
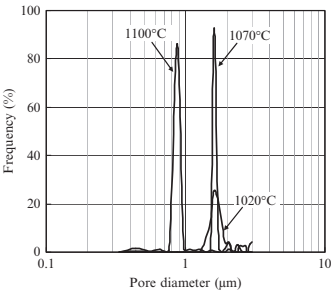
Fig. 17.14 Distributions of minimal pore size of specimens sintered at various temperatures (3μm 316L, 10μm PMMA (60 vol%)).
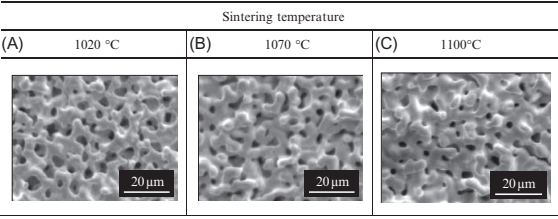
Fig. 17.15 SEM images on surface of specimens sintered at various temperatures (3μm 316L, 10μm PMMA (60 vol%)).
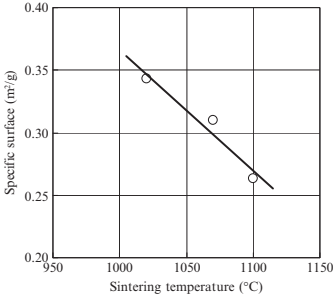
Fig. 17.16 Specific surface as function of sintering temperature (3μm 316L, 10μm PMMA (60 vol%)).
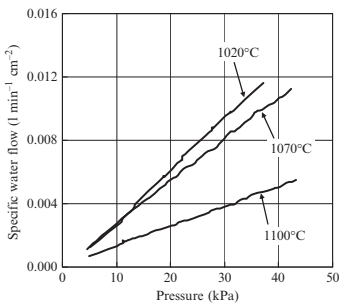
Fig. 17.17 Specific water flow as function of sintering temperature (3μm 316L, 10μm PMMA (60 vol%)).
The transition point between closed porous structures and open porous structures as a function of the fraction of PMMA particles can be estimated by simple geometrical analysis. When we assume that the metal powders are uniformly located around a PMMA particle, this can be modeled as a spherical PMMA particle coated by a single layer of metal powder. When the spheres are close-packed in a face-centered cubic (fcc) structure, the volumetric fraction of PMMA particle reaches its maximum for the closed pore structure. The maximum fraction of PMMA particles, (VPMMA)max, can be derived from Eq. (17.1) as follows:

where dp is the mean diameter of a PMMA particle and dm is the mean diameter of 316L powder. The maximum fraction of PMMA particles for a closed porous structure was estimated by geometric analysis and was then compared to the transition points as a fraction of PMMA particles obtained from experimental results. The shrinking percentage and the porosity for specimens with various size ratios of particle are shown in Fig. 17.18A and B, respectively. The fractions of PMMA particles at these transition points were plotted for several ratios of particle size, R, as shown in Fig. 17.18. For comparison, the maximum fraction of PMMA particles estimated by Eq. (17.1) is drawn together with the curve in Fig. 17.18. The curve indicates the boundary between closed porous and open porous structures. As can be seen, the experimental results agreed well with the curve estimated simply by geometrical analysis.
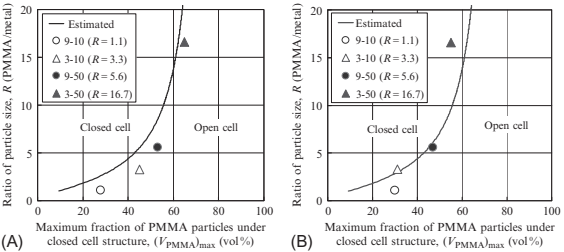
Fig. 17.18 Size ratio of PMMA particle/metal powder versus maximum fraction of PMMA particle under closed cell structure: (A) transition point in shrinkage in diameter and (B) transition point in porosity
This section focuses on the liquid infiltration properties of microporous metals produced by the PSH-MIM process. The effects of testing conditions, surface treatment and pore size on infiltration behavior were mainly investigated by the liquid infiltration test. This type of microporous structure is infiltrated slowly by capillary flow. The liquid can be stored in the pores and is allowed to exude slowly. The test apparatus for evaluating the liquid infiltration performance of the porous specimen was developed using an analytical balance. From the weight change during the liquid infiltration test, the factors affecting water absorption behavior of the porous specimen were shown. The results of the infiltration rate were compared to some important characteristics of the porous specimen such as mean pore diameter, liquid and gas permeability and specific surface area measured by capillary flow porosimeter. The effects of pore size on the infiltration rate were seen with a single digit micrometer in porous specimens of 15μm constricted pore diameter.
A capillary flow porosimeter can be used to determine some important characteristics of porous materials such as (a) distribution of constricted part of a pore channel, f, (b) mean diameter, dm, (c) liquid and gas permeability, KL and KG and (d) specific surface area, Sp. The principle of this method is briefly explained as follows. The pores of a sample are filled by a wetting liquid, which is extruded by increasing the gas pressure gradually. Higher pressures are needed to empty the smaller pores. The pressure required to displace the wetting liquid from the pores can be specified. The flow curve as a function of the difference in pressure is measured for both wet and dry samples. By comparing the gas flow rates of wet and dry porous samples at the same pressures, the percentage of flow passing through the pores larger than or equal to the specified size may be calculated from the pressuresize relationship. A specific surface area is obtained by enveloping the surface area (ESA), which is based on Kozeny-Carman’s equation. Otherwise the test apparatus for evaluating liquid infiltration performance of porous specimens was developed using an analytical balance as shown in Fig. 17.19. In this type of liquid infiltration test, when the porous specimen is soaked in a liquid bath at atmospheric pressure, a liquid is percolated, passing up slowly through the specimen. The weight on the analytical balance changes by buoyancy of specimen and liquid transfer.
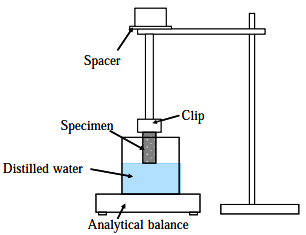
Fig. 17.19 Schematic diagram of apparatus used for evaluating the liquid infiltration performance of porous specimens
Table 17.3 Properties of porous specimens
3-10 | 9-50 | 9-90 | |
Porosity, ε (%) Mean pore diameter, dm (μm) Specific surface area, Sp (m2/g) Liquid permeability, KL Gas permeability, KG | 54.2 1.34 0.343 0.105 0.070 | 60.5 7.29 0.040 3.345 1.564 | 63.1 14.92 0.030 7.518 3.028 |
The method is applied to the liquid infiltration test used here. The percolated height, h, is given by

where W is weight, A and ε are cross-sectional area and porosity of the sample respectively, ρL is the density of liquid. The percolated height, h, is given by Washburn’s equation (17.3), which was developed for the capillary flow in a cylindrical pipe

where r is radius of pipe and t is time. The pressure is assumed to be constant ΔΡ=0, and by substituting Eq. (17.2) in Eq. (17.3), the weight change per unit of crosssectional area of porous specimen is given by

Thus, the infiltration rate, α of liquids in porous specimens can be evaluated by its
slope on the W=√A-√t p plot.
17.5.3 Specimen and experimental results
Porous specimens with the physical properties shown in Table 17.3 were used. The relative density (as an inverse of the porosity) of the sintered porous specimen was measured with micrometer calipers and an analytical balance. A capillary flow porosimeter was used for measurement of pore size distribution. Galwick (γ ¼16mN/m) is used for a wetting liquid. The typical behavior of weight change during immersion of porous specimens is shown in Fig. 17.20. Just after the specimen is immersed in water, the buoyancy and meniscus have a considerable effect on weight (W1). Water infiltrates from an immersed part to a dry part between point A and point B, which causes a significant decrease in weight. The previous point B, the loss of water by evaporation causes a gradual loss of weight (W2). At point C, when the specimen is removed from water, the buoyancy, and meniscus recover (W3). As a result, the amount of water equivalent to the porosity enters the porous specimen (W4-W2).
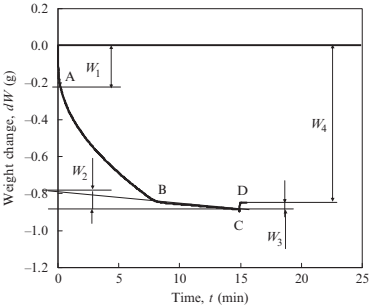
Fig. 17.20 Typical behavior of weight change during immersion of porous specimens (specimen 3-10, l=7.5mm)
Fig. 17.21 shows the weight change of porous specimen 3-10 measured at various immersion lengths. Increasing immersion length reduces the time to reach point B (namely saturation time, ts), thus the saturation time decreases linearly as immersion length increases, as shown in Fig. 17.22. This is because infiltration rate in water is faster than that in air. Fig. 17.23 shows the weight change of porous specimen 3-10 treated with acid cleaning or untreated. The surface treatment significantly improved water infiltration. Table 17.4 reveals that an increasing of infiltration rate by acid cleaning is due to a decreasing of contact angle. Fig. 17.24 shows the effects of pore size on weight change. No significant differences in infiltration rate are seen for specimens 3-10 and 9-50, as summarized in Table 17.5, but the infiltration rate decreases considerably in specimen 9-90. The water absorption volume percentage (Va) also decreases remarkably compared to the specimen with smaller pores.
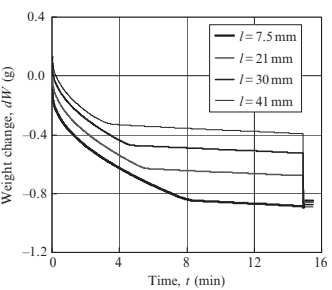
Fig. 17.21 Effects of immersion length on weight change (specimen 3-10)
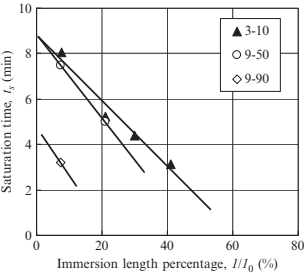
Fig. 17.22 Saturation time versus immersion length
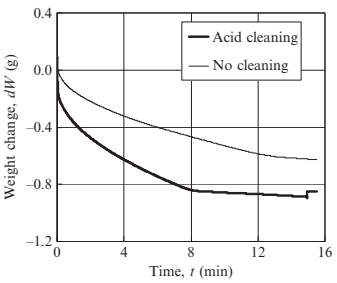
Fig. 17.23 Effects of surface treatment on weight change (specimen 3-10, l¼7.5mm)
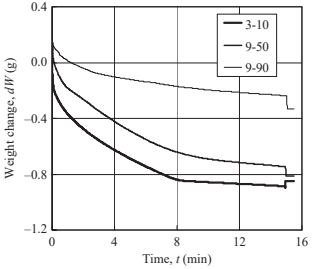
Fig. 17.24 Effects of pore size on weight change (l¼7.5mm)
Table 17.4 Effects of acid cleaning (specimen 3-10, l¼7.5mm)
Table 17.4 Effects of acid cleaning (specimen 3-10, l¼7.5mm)
No cleaning | Acid cleaning | |
Infiltration rate, α Contact angle, θ | 0.013 77.4 | 0.020 58.2 |
Table 17.5 Effects of immersion length and pore size on infiltration rate (α) and infiltration percentage (Va)
3-10 | 9-50 | 9-90 | ||||
l α Va | 7.5 0.020 109% | 21 0.019 113% | 30 0.019 113% | 41 0.018 115% | 7.5 0.018 84% | 7.5 0.005 26% |
From the results described—which were considering the effects of testing conditions, surface treatment and pore size on infiltration behavior of microporous stainless steels with various pore sizes produced by the PSH method and investigated by the liquid infiltration test—some conclusions can be drawn. This type of microporous structure is being infiltrated by a liquid slowly by capillary flow, the liquid can be stored in the pores and is leaving slowly. Some important characteristics of porous materials were measured by capillary flow porometer.
Contact: Cindy Wang
Phone: +86 19916725892
Tel: 0512-55128901
Email: [email protected]
Add: No.6 Huxiang Road, Kunshan development Zone, JiangsuShanghai Branch: No. 398 Guiyang Rd, Yangpu District, Shanghai, China