Metal injection molding (MIM) feedstocks are composed fundamentally of a fine metal powder and complex binder system. The binder is designed to provide flow characteristics during the MIM process and structural rigidity to the resulting solid part during the subsequent debinding and sintering processes. A number of binder systems have been designed, including wax-polymer systems, water-soluble systems, catalytic debindable systems, and water-gel-based systems. With the exception of the latter, the binder systems are solid at room temperature and go through a few melting transitions, one for each component of the binder until the entire system is molten. Processing occurs at temperatures above the final melt temperature of the binder system but well below the decomposition temperature.
The molding of MIM feedstocks is similar to plastics injection molding processes with a few notable exceptions. The thermal characteristics of these materials differ greatly from plastics. The density is much higher, being rather closer to metal than the binder. This is because, while volumetrically the amount of binder is close to 40%, this translates to a weight-based composition exceeding 90% metal. Table 10.1 shows the density of some feedstocks, metals, and plastics.
The measured mass heat capacity Cpm is also similarly affected, being apparently quite low, again closer to metal than the binder system. This number is only apparently small thanks to conventions of the measurement rather than the actual heat capacity of the material. In reality, heat capacity is a volumetric term defined as

where Cpv is the volumetric heat capacity (J/m3 K), ρ is the density (kg/m3 ), and Cpm is the mass heat capacity (J/kg K).
Table 10.1 illustrates this difference for a few common materials in comparison to a typical MIM feedstock. It can be observed that the volumetric heat capacity is not dramatically different for these materials even though the measured mass specific heat is.
Table 10.1 Comparison table showing typical thermal properties of some materials
Material | Density (kg/m3) | Mass heatcapacity (J/kgK) | Volumetric heatcapacity (J/m3K) | Thermal conductivity (W/mK) |
Tungsten Iron MIM POM acetal Wax | 19,300 7900 5100 1400 766 | 134 440 700 1480 2500 | 2,586,200 3,476,000 3,570,000 2,072,000 1,915,000 | 163 76 3 0.28 0.25 |
Thermal conductivity in MIM feedstocks is significantly higher than conventional plastics with numbers 10 times higher than plastics being commonplace. Obviously, this is due to the high content and thermal conductivity of the metal powder. Highly conductive metals will contribute to an increase in the thermal conductivity of the MIM feedstock. Surprisingly, however, the contribution is not proportional, as conventional wisdom would suppose. Instead, the conductivity remains closer to that of the binder system with a relatively smaller dependence on the conductivity of the metal. This is because the heat flow is controlled by the binder system, which constitutes the continuous matrix through which all the heat must flow. Therefore, while heat will flow quickly through each powder particle, the particles are not directly connected and the heat must flow through the intervening binder layer before it reaches the next particle. This layer thus constitutes the greatest resistance to heat flow and provides the correspondingly largest contribution to the thermal conductivity. In previous work with glass-fiber-filled plastics, Lobo and Cohen (1990) showed that the following equation reasonably correlated thermal conductivity with filler content.

where ϕ is the volume fraction and k is the thermal conductivity. The numbers 1 and 2 denote the continuous and dispersed phases, respectively. Table 10.1 gives thermal conductivity of some common materials in comparison to a typical MIM feedstock.
The most important characteristic of MIM feedstocks is the melt rheology, the flow properties of these materials. The rheological behavior of these materials is complex, showing dependencies on temperature and shear rate. The viscosity is observed to decrease with increasing temperature in a manner similar to what is seen in plastics. The temperature dependency unfortunately can be much more complicated than plastics. Plastics are by and large homopolymeric systems, being composed of a single polymer, but binder systems usually are not. When a plastic melts, the entire material moves from solid to melt. The resulting melt viscosity then proceeds to fall predictably with increasing temperature. With binder systems, as each component of the binder system melts, there is a dramatic change in the viscosity, until all components are molten. This process obviously reverses during cooling. This complex behavior is not necessarily detrimental to the processability of MIM feedstocks; it is just more difficult to understand and predict so that computer modeling using commonly available software is not so easy.
Table 10.2 Characteristics of MIM feedstocks used in this study
Material | A | B | C | D |
Binder | Polyacetal | Water soluble | Wax polymer | Wax polymer |
Powder | 17-4PH | 17-4PH | 17-4PH | 17-4PH |
Content (%) | 90 | 91.2 | ||
Particle size (μm) | 22 | 12 | ||
Process temperature (℃) | 190 | 180 | 160 | 170 |
Mold temperature (℃) | 99 | 38 | 40 | 45 |
Another effect not commonly encountered with polymers is slip. Newtonian fluids such as water have a parabolic velocity profile with zero velocity at the wall to a maximum at the center of the flow cavity. Polymers tend to have a uniform nonparabolic shear profile. With highly filled systems such as MIM feedstocks, the velocity at the wall is not zero and a plug flow type profile is observed. This phenomenon also causes some difficulty in modeling because most computeraided engineering (CAE) codes do not account for slip phenomena, assuming only a Rabinowitsch correction, which captures the unique nonparabolic flow profiles typical to polymeric flows.
In the rest of this chapter, experimental methods commonly used to characterize MIM feedstock will be described. The resulting data are explained, particularly unique characteristics that differentiate them from conventional polymers. For the purpose of explaining these properties, four MIM feedstocks were chosen, each with the compositional characteristics described in the Table 10.2.
Rheological measurements typically mean the measurement of viscosity versus shear rate. Data are taken at several temperatures. Two instruments are commonplace for rheology: the capillary rheometer and the cone and plate rheometer.
The capillary rheometer consists of a barrel containing the fluid being tested. One end has a precision capillary die; the other end is fitted with a piston capable of forcing the fluid through the die at a precise flow rate. Pressure drop across the die is measured by means of a pressure transducer located a short distance above the capillary die. The extrudate discharges to the air, so that the pressure measured by the pressure transducer is the pressure drop itself. Knowing the speed of the piston and the diameter of the barrel, the flow rate through the capillary is also known. With this, the viscosity can be calculated as follows

where γ_ ap is the apparent shear rate (/s), Q is the flow rate (mm3 /s), and R is the capillary diameter (mm).

where σw is the wall shear stress (Pa), ΔP is the pressure drop across the capillary die (Pa), and L is the length of capillary die (mm).
Also

where ηap is the apparent shear viscosity (Pas).
The rheometer barrel can be heated so that measurements at different temperatures can be achieved. Capillary rheometers measure what is termed apparent shear viscosity versus apparent shear rate. This is because the data contain known errors that can be corrected for. Developed a correction for the additional pressure drop related to the contraction flow at the entrance to the die and the corresponding expansion at the die exit. The pressure drop related to these extensional effects can be removed by repeating the test with dies of the same diameter but different length-to-diameter (L/D) ratios.
Developed a correction for the fact that the axial velocity profile in the die is not parabolic owing to the shear thinning nature of polymers. While this mathematical correction is routinely performed for polymers, some caution may be advisable in the case of MIM feedstocks because of the possibility of slip at the die wall. Wall slip is a phenomenon that is not seen in polymers; here, the velocity of the fluid in contact with the wall is not zero as is the case with Newtonian fluids and polymers. This results in a plug flow-like behavior. Describe a method to characterize slip by performing measurements with capillary dies of different diameter but the same L/D ratio. In this case, any difference in viscosity would be due to slip. It is then possible to calculate the slip velocity versus shear rate, thereby developing a characterization of this phenomenon. Commercial simulation codes do not typically take slip into consideration.
Looking at some rheological data, it is useful to define some terms. In this context, Newtonian behavior refers to fluids whose viscosity is independent of shear rate. A plot of viscosity against shear rate is a horizontal line. Shear thinning fluids are those whose viscosity decreases with increasing shear rate. On a log viscosity versus log shear rate plot, such data appear as a straight line with negative slope. Sample A shows shear thinning behavior with no tendency toward a Newtonian region over the shear rate range of interest to processing, as seen in Fig. 10.1. In the figure, the lines represent a Cross-Williams-Landel-Ferry (WLF) equation, which is commonly used to describe the non-Newtonian, nonisothermal change in viscosity with shear rate. The data are presented at three temperatures where it can be seen that the viscosity declines with increasing temperature. The rate of change of viscosity with temperature is of interest to processing. A large change suggests a higher sensitivity of viscosity to temperature. In such cases, a small change in temperature will cause a large change in viscosity, significantly altering the flow characteristics of the material.
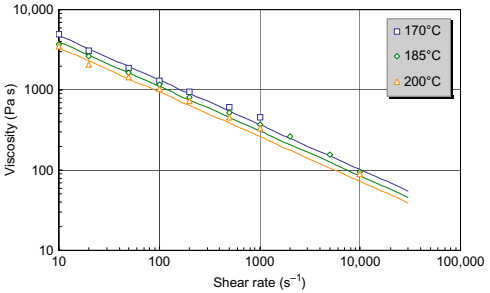
Fig. 10.1 Viscosity of sample A showing shear thinning behavior.
Fig. 10.2 shows the viscosity of sample B, a feedstock with Newtonian behavior at low shear rates. As the shear rate increases, the feedstock is observed to transition to shear thinning behavior. Again, the Cross-WLF equation is observed to be capable of handling this behavior. Sample C (Fig. 10.3) exhibits similar “shear-thinning only” behavior to sample A, but its viscosity is significantly lower than sample A because of the different binder system. The viscosity of sample C is lower than sample D (Fig. 10.4), possibly due to compositional or particle size differences.
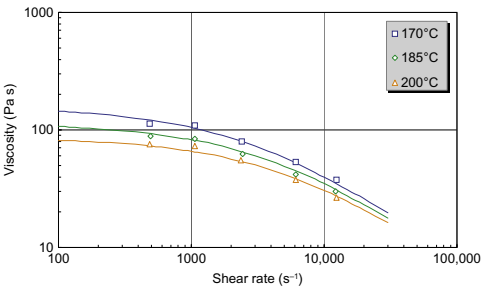
Fig. 10.2 Viscosity of sample B shows a broad Newtonian region.
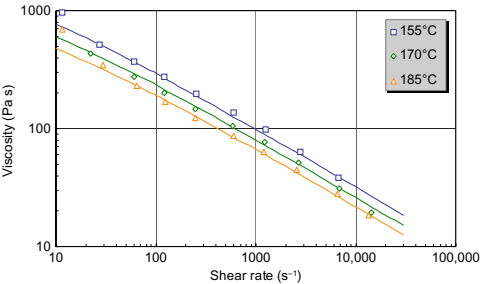
Fig. 10.3 Viscosity of sample C.
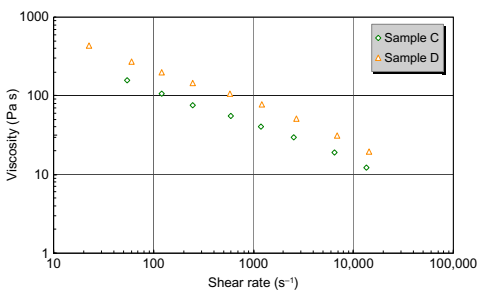
Fig. 10.4 Comparing the viscosity of samples C and D.
Mooney slip velocity measurements were performed on samples C and D to evaluate the effect, if any, on particle size (Fig. 10.5). It is observed that the wall slip is greater for sample D, which has a smaller particle size. The figure also indicates that the wall slip will increase greatly with increasing shear stress, transitioning more and more toward plug flow at very high apparent shear rates.
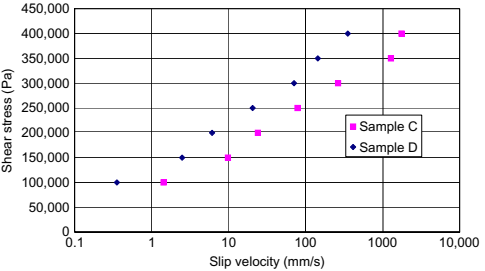
Fig. 10.5 Mooney slip velocity data for samples C and D.
Differential scanning calorimeters (DSCs) are typically the instrument of choice for the characterization of the melting and solidification of MIM feedstocks. The measurement of specific heat is also accomplished using ASTM E1269–11 (2011). The instrument comprises two identical furnaces, one containing a specimen of the material and the other acting as an empty reference. By heating the two furnaces identically at a programmed rate of temperature rise, it is possible to determine the difference in heat needed to keep both furnaces heating at an identical rate. An alternative approach measures the temperature differential as both furnaces are subjected to identical quantities of heat.
During the actual experiment, milligram quantities of the sample are used. The specimen is encapsulated, typically in an aluminum pan, which serves to contain it and prevent leakage and damage to the apparatus. The scanning data are taken by computer and plots of heat flow versus temperature permit the observation of melting and solidification phenomena (Fig. 10.6).
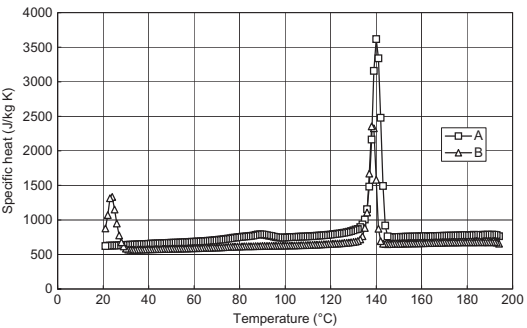
Fig. 10.6 Cooling mode specific heat and transition plots for samples A and B.
Thermal analysis provides an insight into the behavior of the binder system of the MIM feedstock. Binder systems often contain waxes and semicrystalline polymers such as polyethylene, polypropylene, and acetal (POM). In polymeric systems the change in state, from melt to solid and vice versa, is attributable to either a glass transition or a semicrystalline transition. Polymers in their solid states can either be solidified glasses or contain a partially crystallized phase that solidifies the polymer well above the glass transition temperature. When the solidification is due to a glass transition, the polymer becomes brittle and glassy; the temperature at which this occurs is termed the glass transition temperature. Polymers above their glass transition tend toward a rubbery or leathery state, eventually becoming fully molten when heated to a sufficiently high temperature. The glass transition is reversible, implying that solidification occurs by simply reversing the change; cooling below the glass transition temperature returns the polymer to a glassy state.
In the case of semicrystalline polymers, the glass transition is less dramatic as the polymer continues to be quite solid above the glass transition. With increasing temperature, a state is reached where the crystallized fraction begins to melt. This is a kinetic process affected by both time and temperature. Nucleating agents can accelerate the onset of crystallization by providing sites for the initiation of crystallization.The semicrystalline polymer becomes molten when this transition is complete. Because the process is kinetic, the temperature at which the semicrystalline polymer melts depends on the heating rate. A faster heating rate corresponds to a higher melt temperature. The solidification of a molten semicrystalline polymer requires that the melt be super-cooled below the melting point. This super-cooling is needed to create sufficient driving force for the initiation of the crystallization process. Once crystallization is initiated, the conversion is usually fast and the polymer is solid when complete. Note that 100% crystallization does not occur. In Fig. 10.6, the higher temperature peaks observed for samples A and B are typical of the crystallization of the polymeric components of binder systems.
The understanding of these phenomena is vital to comprehending the manner in which polymers transition from melt to solid. The situation with MIM feedstocks is even more complex, with multiple such transitions as each component of the binder system solidifies at its own temperature. The challenge then lies in determining which of these transitions is the crucial transition that takes the whole system from melt to solid. This is not often easily determined from thermal analysis because the size of a given peak is not always an indicator of a major transition. In such cases, the no-flow temperature can provide useful indication of the major transition. The no-flow temperature is an approximate indication of the solidification transition of a material; it measures the temperature at which the material can no longer flow through a capillary die as it is gradually cooled from its melt processing temperature in a capillary rheometer. Table 10.3 shows a comparison of first cooling transition onset temperatures and no-flow temperature for various feedstocks.
Table 10.3 Comparing DSC cooling transitions with no-flow temperature
Material | A | B | C | D |
No-flow temperature (℃) DSC cooling transition | 157 144 | 151 141 | 108 88 | 121 99 |
While it may be argued that the no-flow temperature lacks precision, in the particular case of materials with multiple transitions, it clearly indicates which differential scanning calorimetry (DSC) transition is the cause of solidification of the feedstock. In the case of the data presented, the higher temperature transitions are the ones of consequence.
Wax, the other common component of binders, can be viewed to have similar characteristics to a simple semicrystalline polymer. Waxes transition at low temperatures, below 100°C, and show large transition peaks; observe the lower temperature peak of sample B in Fig. 10.6. However, while waxes may aid feedstock flow by acting as flow enhancers, they do not typically control the melt-solid transition; this is more often than not controlled by the solidification of the polymer.
Specific heat is an additional property that can be obtained from thermal analysis.The measurement requires an additional baseline experiment carried out with empty pans in the DSC which serves as a subtractive reference for the data. With these additional data, the specific heat is conveniently measured as a function of temperature. Data are taken either in heating or cooling mode, with the cooling mode being in common use for the purpose of MIM feedstock modeling.
Fig. 10.7 shows specific heat and transition data for samples C and D, which contain the same binder systems. It can be observed that there is close correspondence between the two curves. The highest transition is shifted lower for sample C, suggesting some kind of kinetic effect on the initiation of crystallization.
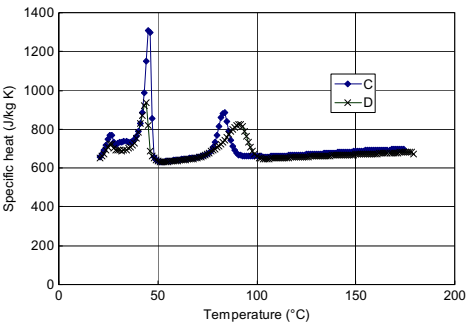
Fig. 10.7 Specific heat and transitions of samples C and D, which have the same binder system.
Measurements of thermal conductivity can be carried out using a variety of instruments. Most are designed for the testing of materials in the solid state. Since our interest is with molten MIM feedstocks, the line-source method is preferred. This is a transient method permitting rapid measurement of thermal conductivity. The test method is covered in ASTM D5930–09 (2009). The test instrument consists of a heated barrel that maintains the material at a constant temperature. The measurement is performed by a line-source needle probe that is inserted into the fluid. The line-source probe contains a heater that runs the entire length of the probe and a temperature sensor located half way along the length of the probe. At equilibrium, the line-source heater sends a heat wave into the fluid. The temperature rise in the probe is recorded with time for 30–45 s. A plot of temperature against log time theoretically yields a straight line, the slope of which can be directly related to thermal conductivity by the following equation

where k is the thermal conductivity (W/mK), Q0 is the heat input per unit length of line source (W/m), C is the probe constant and

where T2 is the temperature recorded at time t2 and T1 is the temperature recorded at time t1.
Data at multiple temperatures are obtained by equilibrating the instrument at each test temperature before applying the temperature transient described earlier. The fluid can be solidified in situ, permitting solid state measurements to be made. Measurements are typically taken in the cooling mode, although it is possible to reheat the solidified material and thereby obtain data in the heating mode. Provides additional details in his book.
Thermal conductivity of MIM feedstocks tends to be rather high relative to plastics.This can result in some scatter as the upper limit of capability of the test instrument is approached with an expected variability of 10%. Typical data are shown in Fig. 10.8. It can be observed that melt state data are typically fairly constant, with a slight increase in melt thermal conductivity being observed as temperature decreases. As the feedstock cools and solidifies, various phases of the binder system begin to crystallize. Because the thermal conductivity values of the crystalline phases are higher than the surrounding amorphous base, the overall thermal conductivity is observed to rise as the material cools.
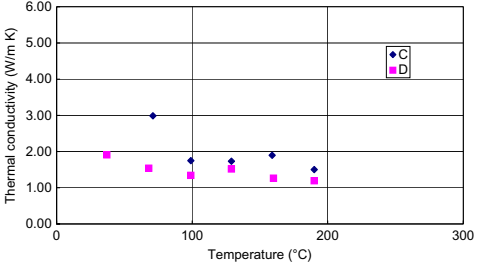
Fig. 10.8 Thermal conductivity of samples C and D.
Consequently, the solid thermal conductivity is typically higher than the melt thermal conductivity. If the binder system contains no waxes or polymers of a semicrystalline nature, then this behavior is not observed and the solid thermal conductivity is close to or lower than the melt thermal conductivity.
The implications for processing are now quite easily understood. The overall high thermal conductivity of these materials renders them able to conduct heat at a faster pace than typical polymers, usually by about 10 times. Molten MIM feedstock is able to solidify much faster as it readily gives heat to the cold mold. The processing becomes more sensitive to the choice of melt and mold temperature. As the melt solidifies, it becomes even more conductive, potentially aggravating the process. Simulating this process also becomes tricky because injection-molding codes are tuned to low thermal conductivity plastics and the predicted onset of the transition becomes extremely important in determining the point of solidification.
One of the most complex pieces of data related to understanding the processing behavior of MIM feedstocks is the equation of state data commonly referred to as the pressure-volume-temperature (PVT) relationship. A high-pressure dilatometer is widely used for these measurements. The preferred test specimen is a molded component as the actual feedstock may have trapped air and change the effective compressibility of the material. The test involves encapsulating the specimen in a confining fluid and then compressing the fluid, thereby generating a hydrostatic pressure field surrounding the specimen. The change in volume is measured.
Data are typically taken by performing pressure cycles at a given temperature (isothermal compression) with the process being repeated after heating and equilibrating at the next test temperature. Other measurement configurations can be used. Each will give different data owing to the various kinetic effects at work as the material melts or solidifies. Fig. 10.9 shows PVT data for a feedstock (sample C). It is seen that at a particular temperature, the specific volume, which is the inverse of the density, decreases with increasing pressure. The specific volume increases with temperature and is described by the volumetric thermal expansion. Multiple transitions can be observed in the data. Because of the cost and complexity of such data, it is sometimes convenient simply to replace these data by a single point value, the melt density. Table 10.4 lists melt densities of some feedstocks.
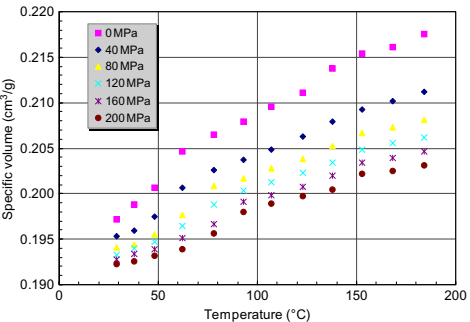
Fig. 10.9 PVT relationship of sample C.
Table 10.4 Melt density of feedstocks
Material | A | B | C | D |
Pressure (MPa) Temperature (℃) Density (kg/m3) | 2 185 4610 | 4 210 4980 | 0 168 4630 | 5 170 4730 |
Knowing this and the solid density, one has a crude approximation of the volumetric thermal expansion of the material and thereby the shrinkage.
The processing of MIM feedstocks is similar to plastic injection molding. The physical properties of these materials differ significantly from plastics, as described earlier. These differences impact the molding of MIM feedstocks. By understanding and accounting for this it is possible to process MIM with considerably higher levels of accuracy. Simulation can be of assistance to MIM processing, particularly if the simulation is able to account for the significant differences that exist in the properties of MIM feedstocks as compared to conventional plastics. Typical challenges that often arise come from the inability of the simulations to handle very high thermal conductivity. In such cases, the simulation cools the material much faster than in real life, leading to underprediction of flow length. The inability to account for wall slip is another issue of some consequence as it can be seen that this phenomenon is prevalent in MIM feedstocks but is less common in plastics, for which the CAE codes were originally designed. Lastly, high density of these materials may make it necessary to consider inertial effects, something that is less important with plastics which have very high viscosities and low densities.
Contact: Cindy Wang
Phone: +86 19916725892
Tel: 0512-55128901
Email: [email protected]
Add: No.6 Huxiang Road, Kunshan development Zone, JiangsuShanghai Branch: No. 398 Guiyang Rd, Yangpu District, Shanghai, China